If you’re buying a new car, you owe it to yourself to do three things:
- Read reviews of the vehicles you’re considering on Edmunds.com, ConsumerReports.org, Car and Driver, etc.
- Consult pricing information from Edmunds and TrueCar
- Review JD Power’s data on initial quality and long-term reliability
Since the first two items are generally well understood (most new car buying advice focuses on these), I’m going to focus on item #3: reviewing data from JD Power.
Why is JD Power Data Important?
JD Power uses the same basic approach that Consumer Reports uses to determine quality and reliability – consumer surveys. However, unlike Consumer Reports (who only surveys their subscribers, a less-than-ideal representation of the buying public), JD Power contacts random vehicle owners.
Thus, JD Power survey data tends to be the most accurate available.
Next, JD Power asks consumers to provide an accounting of the number of problems they’ve had on their vehicles…both a few months after purchasing (the initial quality survey) and after 3 years (vehicle dependability survey). Using this data, JD Power ranks both vehicle brands as well as vehicles by type.
JD Power’s approach – while not perfect – is well regarded in the industry. The people who run car companies look very closely at JD Power data, a good indication of it’s value.
How To Use JD Power Data
First, it’s important to understand what you’re looking at. Here’s their 2013 Initial Quality Survey data:
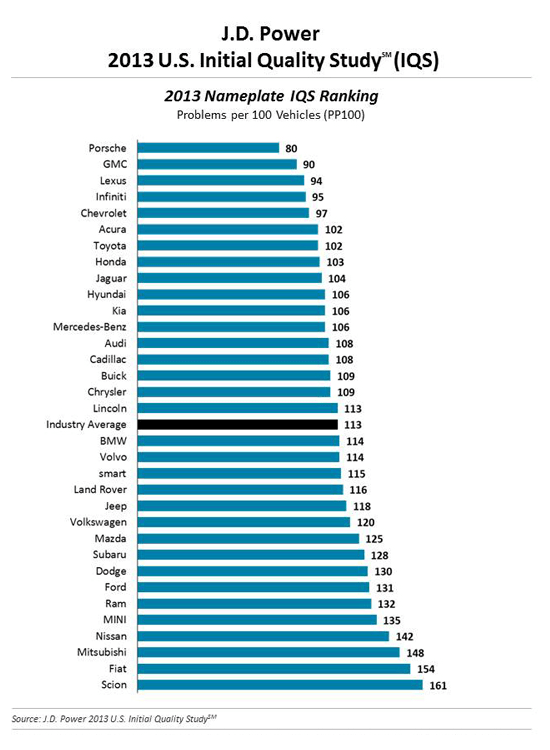
What’s shown is problems per 100 vehicles (PP100) organized from fewest problems to most. Thus:
- The brands listed at the top of the chart (GMC, Porsche, Lexus, Infiniti, and on down the list) offered the best initial quality for the survey period (2013).
- Additionally, it’s a good idea to see what the industry average PP100 was (113 for 2013) so that you can gauge whether or not a particular brand’s quality is above or below average.
Finally, when you’re looking at JD Power quality data, you want to make sure you look at a few year’s worth of info. I’ve pulled together the last 5 years of initial quality data and dependability data below:
Initial Quality Surveys
- 2009 JD Power Initial Quality Survey
- 2010 JD Power Initial Quality Survey
- 2011 JD Power Initial Quality Survey
- 2012 JD Power Initial Quality Survey
- 2013 JD Power Initial Quality Survey
Dependability Surveys
- 2009 U.S. Vehicle Dependability Study
- 2010 U.S. Vehicle Dependability Study
- 2011 U.S. Vehicle Dependability Study
- 2012 U.S. Vehicle Dependability Study
- 2013 U.S. Vehicle Dependability Study
If you take a few minutes to look at each of these links, you’ll learn a lot about brand quality…some brands, like Chrysler, Land Rover, and Volkswagen consistently come in below average. Other brands – like Honda, Toyota, Lexus, and Buick – consistently come in above average.
Good luck in your next purchase!